
TL;DR
kubelet is a service that runs on each worker node in a Kubernetes cluster and is resposible for managing the Pods and containers on a machine. In this article, I will explain how to get kubelet’s metrics via a curl command from a pod via the following command.
curl -k \
-H "Authorization: Bearer $(cat /var/run/secrets/kubernetes.io/serviceaccount/token)"  \
https://192.168.64.7:10250/metrics
- Monitoring a Kubernetes cluster with Prometheus
- Preparation
- Get kubelet’s metrics
- Wrap up
Monitoring a Kubernetes cluster with Prometheus
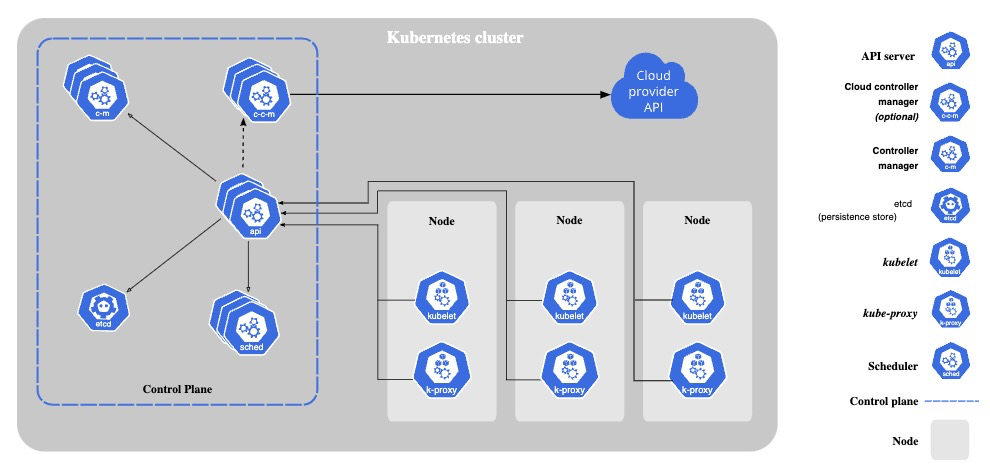
Monitoring a Kubernetes cluster with Prometheus is useful for building dashboards and alerts. However, not many DevOps engineers may understand how Prometheus gets metrics from a Kubernetes Cluster. So let me explain the mechanism!
Kubernetes components emit metrics in Prometheus format via HTTP endpoints, from which Prometheus scrapes metrics.
Example of Kubernetes components that emit metrics:
- kube-apiserver
- kube-scheduler
- kube-controller-manager
- kube-proxy
- kubelet
Preparation
Kubernetes cluster
Please prepare Kubernetes that you can use freely for learning. Here’s my Kubernetes’ version.
kubectl version
Client Version: v1.28.2
Kustomize Version: v5.0.4-0.20230601165947-6ce0bf390ce3
Server Version: v1.28.2
kubelet
Before sending requests to kubelet, please check its configurations via getting shell of node on that kubelet is running.
Check the IP address of the node
Please check the IP address of the node. In my case, the IP address is 192.168.64.7.
$ k get node -o wide
NAME                STATUS   ROLES           AGE     VERSION   INTERNAL-IP    EXTERNAL-IP   OS-IMAGE             KERNEL-VERSION      CONTAINER-RUNTIME
k8s-control-plane   Ready    control-plane   7d11h   v1.28.2   192.168.64.7   <none>        Ubuntu 22.04.3 LTS   5.15.0-84-generic   containerd://1.6.24
Check the port number
kubelet’s port is 10250 by default. Please check your if kubelet is running on 10250.
ssh 192.168.64.7

sudo ss -ltp | grep 10250
LISTEN 0      4096               *:10250             *:*    users:(("kubelet",pid=840244,fd=11))
(Optional) Check the authorization mode
kubelet has two authorization modes, one is AlwaysAllow, another is Webhook.
Check config’s path.
/var/lib/kubelet/pki# ps -ef | grep bin/kubele[t]

root 851050 1 0 Oct14 ? 00:00:23 /usr/bin/kubelet --bootstrap-kubeconfig=/etc/kubernetes/bootstrap-kubelet.conf --kubeconfig=/etc/kubernetes/kubelet.conf --config=/var/lib/kubelet/config.yaml --container-runtime-endpoint=unix:///var/run/containerd/containerd.sock --pod-infra-container-image=registry.k8s.io/pause:3.9
Check the authorization mode.
grep -A 4 authorization /var/lib/kubelet/config.yaml

authorization:
  mode: Webhook
  webhook:
    cacheAuthorizedTTL: 0s
    cacheUnauthorizedTTL: 0s
If kubelet is using AlwaysAllow, there is no need to create the following ClusterRole.
Get kubelet’s metrics
We will send requests to kebelet from a pod that has the permission to access metrics api.

Create a ClusterRole and a ServiceAccount
Create a ClusterRole and a ServiceAccount that can access metrics api of kubelet (node).
kubectl apply -f - <<EOF
apiVersion: rbac.authorization.k8s.io/v1
kind: ClusterRole
metadata:
  name: metrics-role
apiVersion: rbac.authorization.k8s.io/v1
rules:
- apiGroups: [""]
  resources:
  - nodes/metrics
  - nodes/stats
  verbs: ["get"]
---
apiVersion: v1
kind: ServiceAccount
metadata:
  name: metrics-scraper-sa
---
apiVersion: rbac.authorization.k8s.io/v1
kind: ClusterRoleBinding
metadata:
  name: metrics-role-binding
roleRef:
  apiGroup: rbac.authorization.k8s.io
  kind: ClusterRole
  name: metrics-role
subjects:
- kind: ServiceAccount
  name: metrics-scraper-sa
  namespace: default
EOF
Create a Pod from which we will send requests
Create a pod that assumes ServiceAccount you just created above.
kubectl apply -f - <<EOF
apiVersion: v1
kind: Pod
metadata:
  name: metrics-scraper
  namespace: default
spec:
  serviceAccount: metrics-scraper-sa
  containers:
  - command:
    - tail
    - -f
    - /dev/null
    image: alpine/curl
    name: metrics-scraper
    resources: {}
  dnsPolicy: ClusterFirst
  restartPolicy: Always
EOF
Send requests to kubelet
Get a shell of the running pod
kubectl exec -it metrics-scraper -- sh
Send requests to kubelet’ metrics endpoints
kubelet: /metrics
Let’s get metrics by sending a request with Bearer token that was injected the pod. If you’re interested in each metrics’ meaning, please take a look at the official document.
curl -k \
-H "Authorization: Bearer $(cat /var/run/secrets/kubernetes.io/serviceaccount/token)"  \
https://192.168.64.7:10250/metrics
Node Level: /stats/summary
The kubelet gathers metric statistics at the node, volume, pod and container level, and emits this information in the Summary API.
curl -k \
-H "Authorization: Bearer $(cat /var/run/secrets/kubernetes.io/serviceaccount/token)"  \
https://192.168.64.7:10250/stats/summary
Pod Level: /metrics/cadvisor, /metrics/resource, /metrics/probes
The cAdvisor is a container resource usage and performance analysis tool, open sourced by Google. The cAdvisor is embedded in kubelet, so we can get cAdvisor’s metrics via kubelet.
curl -k \
-H "Authorization: Bearer $(cat /var/run/secrets/kubernetes.io/serviceaccount/token)"  \
https://192.168.64.7:10250/metrics/cadvisor
CPU and memory usage per pod can be obtained via /metrics/resource.
curl -k \
-H "Authorization: Bearer $(cat /var/run/secrets/kubernetes.io/serviceaccount/token)"  \
https://192.168.64.7:10250/metrics/resource
Aggregated metrics of container Probe (Readiness/Liveness/StartUp) success or failure can be obtained via /metrics/probes.
curl -k \
-H "Authorization: Bearer $(cat /var/run/secrets/kubernetes.io/serviceaccount/token)"  \
https://192.168.64.7:10250/metrics/probes
Delete Kubernetes objects
For cleaning up, please delete Kubernetes objects you created in this tutorial.
kubectl delete pod metrics-scraper
kubectl delete sa metrics-scraper-sa
kubectl delete clusterrolebindings metrics-role-binding
kubectl delete clusterrole metrics-role
Wrap up
We got kubelet’s metrics via a curl command from a pod. It should now be clear how Prometheus gets the kubelet metrics!
