
TL;DR
In this article, I will explain how to get kube-scheduler’s metrics via a curl command from a pod via the following command.
curl -s -k \
-H "Authorization: Bearer $(cat /var/run/secrets/kubernetes.io/serviceaccount/token)"  \
https://192.168.64.7:10259/metrics
Monitoring a Kubernetes cluster with Prometheus
Monitoring a Kubernetes cluster with Prometheus is useful for building dashboards and alerts. However, not many DevOps engineers may understand how Prometheus gets metrics from a Kubernetes Cluster. So let me explain the mechanism!
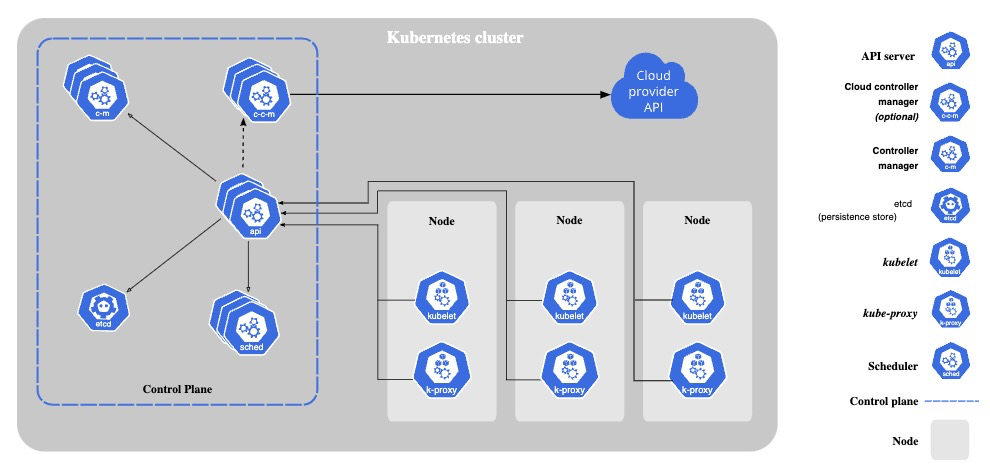
Kubernetes components emit metrics in Prometheus format via HTTP endpoints, from which Prometheus scrapes metrics.
Example of Kubernetes components that emit metrics:
- kube-apiserver
- kube-scheduler
- kube-controller-manager
- kube-proxy
- kubelet
Preparation
Kubernetes cluster
Please prepare Kubernetes that you can use freely for learning. Here’s my Kubernetes’ version.
kubectl version
Client Version: v1.28.2
Kustomize Version: v5.0.4-0.20230601165947-6ce0bf390ce3
Server Version: v1.28.2
kube-scheduler
Before sending requests to kube-scheduler, please check its configurations.
bind-address and port
Please check kube-scheduler’s bind-address and port.
Example: In my case, bind-address is 127.0.0.1 and port is 10259. I ran ss command on the master node.
sudo ss -ltp | grep -e kube-scheduler -e ^State

State  Recv-Q Send-Q Local Address:Port   Peer Address:PortProcess
LISTEN 0      4096       127.0.0.1:10259       0.0.0.0:*    users:(("kube-scheduler",pid=1109,fd=3))
If bind-address is not 0.0.0.0, kube-scheduler is unreachable from outside of host network. So, I will change bind-address to 0.0.0.0. If you’re bind-address is already 0.0.0.0, please skip this step.
I set up my cluster with Kubeadm, then kube-scheduler is running as a Static Pod. So, I can change it by editing the Static Pod’s manifest on the host.
Create back up of the original manifest.
sudo cp /etc/kubernetes/manifests/kube-scheduler.yaml $HOME/kube-scheduler.yaml.bk
Edit bind-address via sed.
sudo sed -i 's/--bind-address=127.0.0.1/--bind-address=0.0.0.0/' /etc/kubernetes/manifests/kube-scheduler.yaml
Static Pod should be recreated soon after the manifest is changed. Let’s confirm the bind-address is changed.
sudo ss -ltp | grep -e kube-scheduler -e ^State

State  Recv-Q Send-Q Local Address:Port   Peer Address:PortProcess
LISTEN 0      4096               *:10259             *:*    users:(("kube-scheduler",pid=168058,fd=3))
IP address
Please check your kube-scheduler’s ip address. In my case, kube-scheduler is running as a pod, so I can check it via kubectl get po -o wide.
$ kubectl get po -o wide -n kube-system | grep -e kube-scheduler -e ^NAME

NAME                                        READY   STATUS    RESTARTS      AGE   IP             NODE                NOMINATED NODE   READINESS GATES
kube-scheduler-k8s-control-plane            1/1     Running   0             21m   192.168.64.7   k8s-control-plane   <none>           <none>
Get kube-scheduler’s metrics
We will send requests to kube-scheduler from a pod that has the permission to access metrics api of kube-scheduler.

Create a ClusterRole and a ServiceAccount
Create a ClusterRole and a ServiceAccount that can access metrics api of kube-scheduler.
kubectl apply -f - <<EOF
apiVersion: rbac.authorization.k8s.io/v1
kind: ClusterRole
metadata:
  name: metrics-role
apiVersion: rbac.authorization.k8s.io/v1
rules:
  - nonResourceURLs:
      - "/metrics"
    verbs: ["get"]
---
apiVersion: v1
kind: ServiceAccount
metadata:
  name: metrics-scraper-sa
---
apiVersion: rbac.authorization.k8s.io/v1
kind: ClusterRoleBinding
metadata:
  name: metrics-role-binding
roleRef:
  apiGroup: rbac.authorization.k8s.io
  kind: ClusterRole
  name: metrics-role
subjects:
- kind: ServiceAccount
  name: metrics-scraper-sa
  namespace: default
EOF
Create a Pod from which we will send requests
Create a pod that assumes ServiceAccount you just created above.
kubectl apply -f - <<EOF
apiVersion: v1
kind: Pod
metadata:
  name: metrics-scraper
  namespace: default
spec:
  serviceAccount: metrics-scraper-sa
  containers:
  - command:
    - tail
    - -f
    - /dev/null
    image: alpine/curl
    name: metrics-scraper
    resources: {}
  dnsPolicy: ClusterFirst
  restartPolicy: Always
EOF
Send requests to kube-scheduler
Get a shell of the running pod
kubectl exec -it metrics-scraper -- sh
Send requests to kube-scheduler’s metrics endpoints
Let’s get metrics by sending a request with Bearer token that was injected the pod. If you’re interested in each metrics’ meaning, please take a look at the official document.
curl -k \
-H "Authorization: Bearer $(cat /var/run/secrets/kubernetes.io/serviceaccount/token)"  \
https://<IP Address>:<Port>/metrics
Example: Number of pending pods, by the queue type.
curl -s -k \
-H "Authorization: Bearer $(cat /var/run/secrets/kubernetes.io/serviceaccount/token)"  \
https://192.168.64.7:10259/metrics | grep scheduler_pending_pods

# HELP scheduler_pending_pods [STABLE] Number of pending pods, by the queue type. 'active' means number of pods in activeQ; 'backoff' means number of pods in backoffQ; 'unschedulable' means number of pods in unschedulablePods that the scheduler attempted to schedule and failed; 'gated' is the number of unschedulable pods that the scheduler never attempted to schedule because they are gated.

# TYPE scheduler_pending_pods gauge
scheduler_pending_pods{queue="active"} 0
scheduler_pending_pods{queue="backoff"} 0
scheduler_pending_pods{queue="gated"} 0
scheduler_pending_pods{queue="unschedulable"} 0
Delete Kubernetes objects
For cleaning up, please delete Kubernetes objects you created in this tutorial.
kubectl delete pod metrics-scraper
kubectl delete sa metrics-scraper-sa
kubectl delete clusterrolebindings metrics-role-binding
kubectl delete clusterrole metrics-role
Wrap up
We got kube-scheduler’s metrics via a curl command from a pod. It should now be clear how Prometheus gets the kube-scheduler’s metrics!
