

TL;DR
In this post, I explain how Tetragon detects process creation and termination using eBPF.🐝
Introduction
I was really impressed when I used Tetragon for the first time. Just after deploying Tetragon, it automatically collected process lifecycle events like:
🚀 process lima-tetragon-dev /usr/bin/cat /etc/passwd
💥 exit    lima-tetragon-dev /usr/bin/cat /etc/passwd 0
I’ve been reading Tetraon’s code to understand its implementaion in kernel-space and user-space programs. Now that I mostly understood how Tetragon observes the process lifecycle, I will share it with you. This story is a bit long, so I will split it into two parts: the eBPF part and the Tetragon Agent part. In this post, I will explain the eBPF part.
Note: I refer to the v1.1.0 Tetragon code on GitHub.
Overview
Beforediving into the eBPF part, let’s take a look at how the process lifecycle data flows through various components of Tetragon.
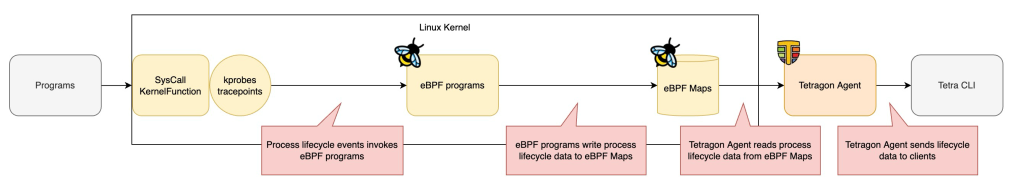
kprobes and tracepoints
To detect process lifecycle events, Tegragon uses some kprobes (kernel probe) and tracepoints. Several eBPF programs are attached to kprobes and tracepoints.
eBPF Programs
Once a process lifecycle event occurs, eBPF programs process it and extract the necessary data.
eBPF Maps
eBPF Maps serve as a data store between eBPF programs in kernel space and the Tetragon Agent in user space. eBPF programs write lifecycle data into eBPF Maps, and the Tetragon Agent reads it.
Tetragon Agent
Tetragon Agent runs in the user space. It reads event data from eBPF Maps and sends them to clients.
Process creation

eBPF program attached to tracepoint
To detect process creations, Tetragon attaches an eBPF program called event_execve to tracepoint/sys_execve. You can find the code here.
__attribute__((section("tracepoint/sys_execve"), used)) int
event_execve(struct sched_execve_args *ctx)
{...}
You can find the eBPF program loaded into the kernel using bpftool:
bpftool prog show name event_execve --json --pretty
{
    "id": 124,
    "type": "tracepoint",
    "name": "event_execve",
    "tag": "d61a795254fe9f98",
    "gpl_compatible": true,
    "loaded_at": 1715928076,
    "uid": 0,
    "orphaned": false,
    "bytes_xlated": 125288,
    "jited": true,
    "bytes_jited": 102032,
    "bytes_memlock": 126976,
    "map_ids": [110,109,73,74,76,108,78,79,116,113,72,77
    ],
    "btf_id": 234,
    "pids": [{
            "pid": 28589,
            "comm": "tetragon"
        }
    ]
}
If you cannot find it, ensure Tetragon is running.
To check if the eBPF program is attached to tracepoint/sys_execve, execute:
bpftool perf list --json \
| jq '.[] | select(.fd_type=="tracepoint") | select( .tracepoint | contains("process_exec"))'
{
  "pid": 28589,
  "fd": 52,
  "prog_id": 124,
  "fd_type": "tracepoint",
  "tracepoint": "sched_process_exec"
}
The prog_id should match the event_execve program’s ID you got before. In my case, the ID was 124.
As an additional information, your kernel’s all available tracepoints are listed in /sys/kernel/tracing/available_events. So, you can find the sched_process_exec tracepoint in it by executing:
grep sched_process_exec -R /sys/kernel/tracing/available_events
sched:sched_process_exec
Write data to eBPF Map
Once event_execve eBPF program is invoked, it calls another eBPF program named exec_send via a tail call:
tail_call(ctx, &execve_calls, 0);
Tail calls allow one BPF program to call another, without returning back to the old program. If you’re interested in Tail calls, please check Cilium documentation here.
You can find the exec_send eBPF program loaded into the kernel using:
bpftool prog show name execve_send --json --pretty

{
"id": 123,
"type": "tracepoint",
"name": "execve_send",
"tag": "88fbb70206233b76",
"gpl_compatible": true,
"loaded_at": 1715928076,
"uid": 0,
"orphaned": false,
"bytes_xlated": 112368,
"jited": true,
"bytes_jited": 91536,
"bytes_memlock": 114688,
"map_ids": [110,109,73,78,79
],
"btf_id": 233
}
The exec_send eBPF program writes process creation data to eBPF Map named tcpmon_map by calling perf_event_output_metric function.
perf_event_output_metric(ctx, MSG_OP_EXECVE, &tcpmon_map, BPF_F_CURRENT_CPU, event, size);
The perf_event_output_metric writes data to an eBPF Map that is specified in an argument.
err = perf_event_output(ctx, map, flags, data, size);
The tcpmon_map eBPF Map is defined in lib/bpf_event.h:
struct {
	__uint(type, BPF_MAP_TYPE_PERF_EVENT_ARRAY);
	__type(key, int);
	__type(value, struct event);
} tcpmon_map SEC(".maps");
The BPF_MAP_TYPE_PERF_EVENT_ARRAY type maps store data in a buffer ring that communicates between BPF programs and user-space programs in real time. You can find tcpmon_map eBPF Map created in your kernel by executing:
bpftool map show name tcpmon_map --json --pretty

{
    "id": 78,
    "type": "perf_event_array",
    "name": "tcpmon_map",
    "flags": 0,
    "bytes_key": 4,
    "bytes_value": 4,
    "max_entries": 8,
    "bytes_memlock": 4096,
    "frozen": 0,
    "pids": [{
            "pid": 28589,
            "comm": "tetragon"
        }
    ]
}
Process termination
eBPF program attached to tracepoint
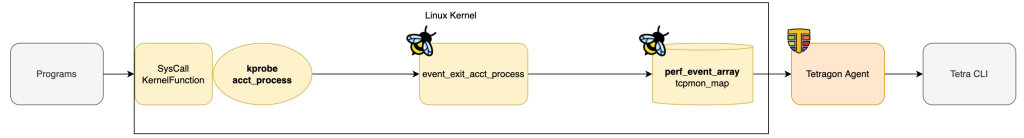
To detect process termination, Tetragon attaches an eBPF program called event_exit_acct_process to kprobe/acct_process. You can find the code here.
__attribute__((section("kprobe/acct_process"), used)) int
event_exit_acct_process(struct pt_regs *ctx)
{...}
You can find the eBPF program loaded into the kernel by executing:
bpftool prog show name event_exit_acct_process --json --pretty

{
    "id": 118,
    "type": "kprobe",
    "name": "event_exit_acct_process",
    "tag": "64a610ea4a599250",
    "gpl_compatible": true,
    "loaded_at": 1715928075,
    "uid": 0,
    "orphaned": false,
    "bytes_xlated": 3256,
    "jited": true,
    "bytes_jited": 2876,
    "bytes_memlock": 4096,
    "map_ids": [73,87,72,91,80,81,78,79,75
    ],
    "btf_id": 204,
    "pids": [{
            "pid": 28589,
            "comm": "tetragon"
        }
    ]
}
To check if the eBPF program is attached to kprobe/acct_process, execute:
bpftool perf list --json \
| jq '.[] | select(.fd_type=="kprobe") | select( .func | contains("acct_process"))'

{
  "pid": 28589,
  "fd": 41,
  "prog_id": 118,
  "fd_type": "kprobe",
  "func": "acct_process",
  "offset": 0
}
You can see that prog_id maches the event_exit_acct_process prog’s ID you got before. In my case, the ID was 118.
Write data to eBPF Map
Once event_exit_acct_processevent_exit_send function:
event_exit_send(ctx, pid_tgid >> 32);
The event_exit_send function writes process termination data to tcpmon_map eBPF Map which is also used by process cretion data!
perf_event_output_metric(ctx, MSG_OP_EXIT, &tcpmon_map, BPF_F_CURRENT_CPU, exit, size);
Wrap up

I explained an overview of how the process lifecycle data flows in several components of Tetragon. Also, I shared how Tetragon’s eBPF programs detect process creation and process termination at the code level. The key point is that tcpmon_map eBPF Map is used in both process creation and termination data flows!
Next step
Next, I will explain how Tetragon Agent reads data from tcpmon_map eBPF Map and send data to clients. Please check out Tetragon Process Lifecycle Observation: Tetragon Agent Part 🐝🐝🐝
