

TL;DR
In this post, I’ll walk you through an example of an eBPF RawTracepoint program using Aya with Rust. 🦀🐝
- Introduction: RawTracepoints vs Tracepoints
- Run eBPF RawTracepoint tracing program
- Check eBPF Program in the Kernel
- Argument Handling in RawTracepoints
- Thoughts
- References
- Wrap up
Introduction: RawTracepoints vs Tracepoints
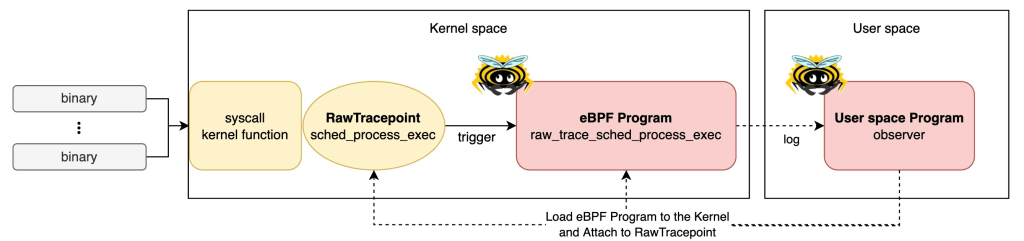
RawTracepoints and Tracepoints in the Linux kernel are static markers placed at key locations within the kernel code. These markers help debugging, performance monitoring, and deeper insights into kernel behavior. Developers can attach probe functions to these markers, which are triggered when the tracepoint is activated. eBPF programs can be attached to both of them. There are two key differences between them.
Argument Handling
Raw Tracepoints: These pass the raw arguments directly to the eBPF program without any pre-processing by the kernel. This means that the eBPF program receives the arguments exactly as they are. It handles casting or transformation only if necessary.
Tracepoints: In contrast, tracepoints involve some level of pre-processing where the kernel constructs the appropriate parameter fields before passing them to the eBPF program. This can include casting or transforming the arguments into a more usable form for the eBPF program.
Performance
RawTracepoints generally perform better than regular Tracepoints due to the lack of argument pre-processing.
(For a deeper dive into eBPF Tracepoints, check out my previous post.)
Run eBPF RawTracepoint tracing program
Let’s run an eBPF RawTracepoint tracing program on your machine!
Prerequisites
- Linux
- Rust nightly
- bpf-linker
- bindgen-cli
- bpftool
(Optional) Set up environment on MacOS
If you’re using MacOS, you can quickly set it up with lima and my template.
- Install lima
brew install lima
- Download the template
wget https://raw.githubusercontent.com/yukinakanaka/aya-lab/main/lima-vm/aya-lab.yaml
- Edit cpu and memory configuration in
aya-lab.yaml. Default values are:
cpus: 4
memory: "8GiB"
- Create a VM
limactl start lima-vm/aya-lab.yaml
Check available Tracepoints
List all available Tracepoints on your kernel:
sudo cat /sys/kernel/tracing/available_events
Ensure the sched:sched_process_exec tracepoint is available:
grep process_exec /sys/kernel/tracing/available_events
sched:sched_process_exec
Clone the Repository
Get all the codes from my repository.
git clone https://github.com/yukinakanaka/aya-lab.git
cd aya-lab/raw-tracepoint-sched-process-exec
Generate Structs codes
Run the next command to generate the necessary struct codes:
cargo xtask codegen
Build and Run
Build and execute the program!
cargo xtask build && sudo ./target/debug/observer
You should see logs from the eBPF program showing information extracted from the RawTracepoint:!
- Example:
2024-08-12T06:49:46.478761Z  INFO raw_trace_sched_process_exec: task.pid: 82000, old_pid: 82000, linux_binprm.filename: /bin/sh, ctx.uid: 502
2024-08-12T06:49:46.479068Z  INFO raw_trace_sched_process_exec: task.pid: 82001, old_pid: 82001, linux_binprm.filename: /usr/bin/which, ctx.uid: 502
2024-08-12T06:49:46.480403Z  INFO raw_trace_sched_process_exec: task.pid: 82002, old_pid: 82002, linux_binprm.filename: /bin/sh, ctx.uid: 502
2024-08-12T06:49:46.480770Z  INFO raw_trace_sched_process_exec: task.pid: 82003, old_pid: 82003, linux_binprm.filename: /usr/bin/ps, ctx.uid: 502
Check eBPF Program in the Kernel
While you’re running the eBPF program, let’s check eBPF Program in your Kernel!
eBPF Program
You can see the eBPF Program loaded into the kernel:
sudo bpftool prog list name raw_trace_sched.
Example output:
sudo bpftool prog list name raw_trace_sched

545: tracing  name raw_trace_sched  tag f0af3a35faf0150e  gpl run_time_ns 5950081 run_cnt 206
        loaded_at 2024-08-12T19:13:02+0900  uid 0
        xlated 4360B  jited 4172B  memlock 8192B  map_ids 123,124,122
        pids observer(82865)
Attachment to RawTracepoint
You can see the eBPF program is attached to the RawTracepoint sched_process_exec:
sudo bpftool perf --json | jq .
Example output:
sudo bpftool perf --json | jq .

[
  {
    "pid": 82865,
    "fd": 17,
    "prog_id": 545,
    "fd_type": "raw_tracepoint",
    "tracepoint": "sched_process_exec"
  }
]
Argument Handling in RawTracepoints
Handling arguments is crucial in eBPF RawTracepoint program. So, let me explain about it. The program gets RawTracepoints arguments easily by:
    let task: *const task_struct = ctx.arg(0);
    let old_pid: pid_t = ctx.arg(1);
    let linux_binprm: *const linux_binprm = ctx.arg(2);
How to Identify Argument Types
To decide the number and types of arguments, you need to inspect the kernel code. The spec of sched_process_exec is defined here.
/*
 * Tracepoint for exec:
 */
TRACE_EVENT(sched_process_exec,

	TP_PROTO(struct task_struct *p, pid_t old_pid,
		 struct linux_binprm *bprm),
       ...
This indicates that the tracepoint sched_process_exec takes three arguments: a pointer to a task_struct, an old_pid of type pid_t, and a pointer to a linux_binprm.
If you’d like to know other RawTracepoint’s arguments, please check kernel codes in /include/trace/events at GitHub or Bootlin. If you want to specify the kernel version, Bootlin is a good choice.

Generate Struct Codes by aya-tool
The first argument is deserialized as a task_struct pointer and the third argument as a linux_binprm pointer. How can we know these data types structs?
Linux has the /sys/kernel/btf/vmlinux, that contains a description of all internal kernel type. The aya-tool can generate Rust struct codes using it. When we run cargo xtask codegen, xtask/src/codegen.rs generates Rust Codes in ebpf/src/bindings.rs.
Creating Safe References
    let task = &*task;
    let linux_binprm: &linux_binprm = &*linux_binprm;
Raw pointers in Rust do not have the safety guarantees that Rust usually provides with its references. They can point to invalid memory or be null, and they don’t automatically manage memory. By converting them to safe references, the code ensures that Rust’s borrow checker can enforce safety rules. These rules include ensuring that references are valid and properly scoped.
Thoughts
BtfTracePoint vs RawTracePoint
Aya provides two ways to handle raw_tracepoint. One is BtfTracePoint which I used in this post. The other is RawTracePoint. What is the difference of them?
Although documentation on the differences is sparse, BtfTracePoint is a newer method that utilizes BTF, making it more portable than RawTracePoint.
    let btf = Btf::from_sys_fs()?;
    let program: &mut BtfTracePoint = bpf
        .program_mut("raw_trace_sched_process_exec")
        .unwrap()
        .try_into()?;
    program.load("sched_process_exec", &btf)?;
    program.attach()?;
BTF
Aya document says ‘Support for the BPF Type Format (BTF), which is transparently enabled when supported by the target kernel. This allows eBPF programs compiled against one kernel version to run on different kernel versions without the need to recompile.’
I plan to explore this topic further in a future post.
References
- Writing eBPF Tracepoint Program with Rust Aya: Tips and Example
- Frequently asked questions about using tracepoint with ebpf/libbpf programs
- Aya Community’s discord
- How to write an eBPF/XDP load-balancer in Rust
- aya-examples
Wrap up
In this post, I demonstrated how to create an eBPF RawTracepoint program using Aya and Rust. I covered key aspects like argument handling and shared tips for writing eBPF programs with Aya. I hope this guide helps you in your eBPF programming journey! 🦀🐝
