

TL;DR
This guide demonstrates how to implement eBPF Tail Calls using Rust’s Aya. 🦀🐝
- Introduction: Tail Calls
- Run eBPF Tail Calls program
- Check eBPF Programs and Maps in the Kernel
- Rust Code Highlights
- References
- Wrap up
Introduction: Tail Calls
Tail calls in eBPF allow splitting complex logic into multiple programs, functioning like a ‘goto’ statement. Benefits of using tail calls include distributing complexity across smaller parts and updating or replacing logic without downtime.
However, there are some restrictions:
- A program can execute a maximum of 32 tail calls per invocation to prevent infinite loops.
- When adding programs to a program array, they must be compatible. This means they should have the same prog_type, expected_attach_type, attached_btf_id, etc.
- Up to Linux kernel 5.9, tail calls and subprograms couldn’t be used together. Check here for details.
Sharing state in eBPF tail calls is challenging. One solution is using eBPF Map: Per CPU Array with a single entry, as eBPF programs don’t switch CPUs between tail calls.
Run eBPF Tail Calls program
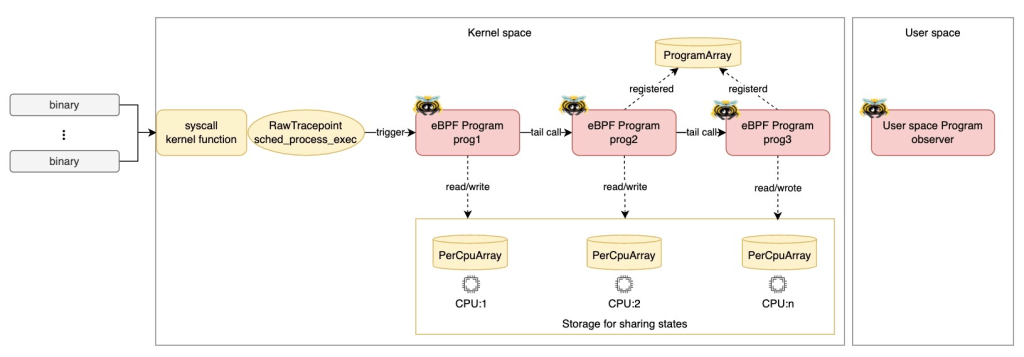
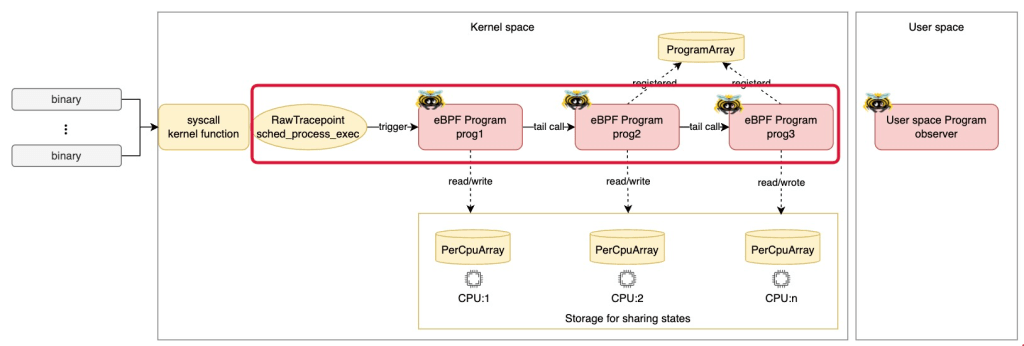
Let’s run an eBPF program that uses tail calls! As shown in the diagram above, prog1 is attached to the raw tracepoint: sched_process_exec, and it tail-calls prog2. Then, prog2 tail-calls prog3.
Prerequisites
- Linux
- Rust nightly
- bpf-linker
- bindgen-cli
- bpftool
(Optional) Set up environment on MacOS
If you’re using MacOS, you can quickly set it up with lima and my template.
- Install lima
brew install lima
- Download the template
wget https://raw.githubusercontent.com/yukinakanaka/aya-lab/main/lima-vm/aya-lab.yaml
- Edit cpu and memory configuration in
aya-lab.yaml. Default values are:
cpus: 4
memory: "8GiB"
- Create a VM
limactl start lima-vm/aya-lab.yaml
Clone the Repository
Get all the codes from my repository.
git clone https://github.com/yukinakanaka/aya-lab.git
cd aya-lab/tail-calls
Generate Struct codes
Run the next command to generate the necessary Struct codes:
cargo xtask codegen
Build
cargo xtask build
Run
sudo ./target/debug/observer
Check logs
You can see logs like the ones below. As you can see, prog2 is called after prog1, and prog3 is called after prog2. This is how tail calls work! Additionally, the state (per_event_count, total_count) is successfully shared between tail calls!
2024-10-09T08:03:46.976944Z  INFO ebpf::progs: [prog1] cpu_id: 0, tgid: 97003, per_event_count: 1, total_count: 1
2024-10-09T08:03:46.977052Z  INFO ebpf::progs: [prog2] cpu_id: 0, tgid: 97003, per_event_count: 2, total_count: 2
2024-10-09T08:03:46.977091Z  INFO ebpf::progs: [prog3] cpu_id: 0, tgid: 97003, per_event_count: 3, total_count: 3
2024-10-09T08:03:46.977634Z  INFO ebpf::progs: [prog1] cpu_id: 0, tgid: 97004, per_event_count: 1, total_count: 4
2024-10-09T08:03:46.977685Z  INFO ebpf::progs: [prog2] cpu_id: 0, tgid: 97004, per_event_count: 2, total_count: 5
2024-10-09T08:03:46.977723Z  INFO ebpf::progs: [prog3] cpu_id: 0, tgid: 97004, per_event_count: 3, total_count: 6
2024-10-09T08:03:46.980480Z  INFO ebpf::progs: [prog1] cpu_id: 1, tgid: 97005, per_event_count: 1, total_count: 1
2024-10-09T08:03:46.980610Z  INFO ebpf::progs: [prog2] cpu_id: 1, tgid: 97005, per_event_count: 2, total_count: 2
2024-10-09T08:03:46.980647Z  INFO ebpf::progs: [prog3] cpu_id: 1, tgid: 97005, per_event_count: 3, total_count: 3
2024-10-09T08:03:46.981333Z  INFO ebpf::progs: [prog1] cpu_id: 0, tgid: 97006, per_event_count: 1, total_count: 7
2024-10-09T08:03:46.981390Z  INFO ebpf::progs: [prog2] cpu_id: 0, tgid: 97006, per_event_count: 2, total_count: 8
2024-10-09T08:03:46.981425Z  INFO ebpf::progs: [prog3] cpu_id: 0, tgid: 97006, per_event_count: 3, total_count: 9
2024-10-09T08:03:46.996001Z  INFO ebpf::progs: [prog1] cpu_id: 2, tgid: 97010, per_event_count: 1, total_count: 1
2024-10-09T08:03:46.996034Z  INFO ebpf::progs: [prog2] cpu_id: 2, tgid: 97010, per_event_count: 2, total_count: 2
2024-10-09T08:03:46.996057Z  INFO ebpf::progs: [prog3] cpu_id: 2, tgid: 97010, per_event_count: 3, total_count: 3
Check eBPF Programs and Maps in the Kernel
While you’re running the eBPF program, let’s check eBPF Programs and Map in your Kernel!
eBPF Programs
Loaded eBPF Programs
You can see the eBPF Programs, prog1, prog2 and prog3 loaded into the kernel by using the following command:
sudo bpftool prog list --json \
| jq -c '[.[] | select(.name | contains("prog"))] | sort_by(.name) | .[]'
Please check the ID of each program. We will use them in the steps below.
Example output:
{"id":458,"type":"tracing","name":"prog1","tag":"e565e9de685a30d2","gpl_compatible":true,"run_time_ns":80097915,"run_cnt":1605,"loaded_at":1728461486,"uid":0,"orphaned":false,"bytes_xlated":4928,"jited":true,"bytes_jited":3176,"bytes_memlock":8192,"map_ids":[338,339,340,335,337,336],"pids":[{"pid":97132,"comm":"observer"}]}
{"id":456,"type":"tracing","name":"prog2","tag":"245a02a028fc91b8","gpl_compatible":true,"loaded_at":1728461486,"uid":0,"orphaned":false,"bytes_xlated":4944,"jited":true,"bytes_jited":3184,"bytes_memlock":8192,"map_ids":[338,339,340,335,337,336],"pids":[{"pid":97132,"comm":"observer"}]}
{"id":457,"type":"tracing","name":"prog3","tag":"4eaa27dcfcc8d75c","gpl_compatible":true,"loaded_at":1728461486,"uid":0,"orphaned":false,"bytes_xlated":3336,"jited":true,"bytes_jited":2248,"bytes_memlock":4096,"map_ids":[338,339,335,336,337],"pids":[{"pid":97132,"comm":"observer"}]}
Attached eBPF Programs
You can see only prog1 attached into the raw tracepoint by using the following command:
sudo bpftool perf --json | jq .
The prog_id must match the ID of prog1 that you checked in the previous step. In this case, the prog_id is 458.
Example output:
[
  {
    "pid": 97132,
    "fd": 22,
    "prog_id": 458,
    "fd_type": "raw_tracepoint",
    "tracepoint": "sched_process_exec"
  }
]
eBPF Map for tail calls
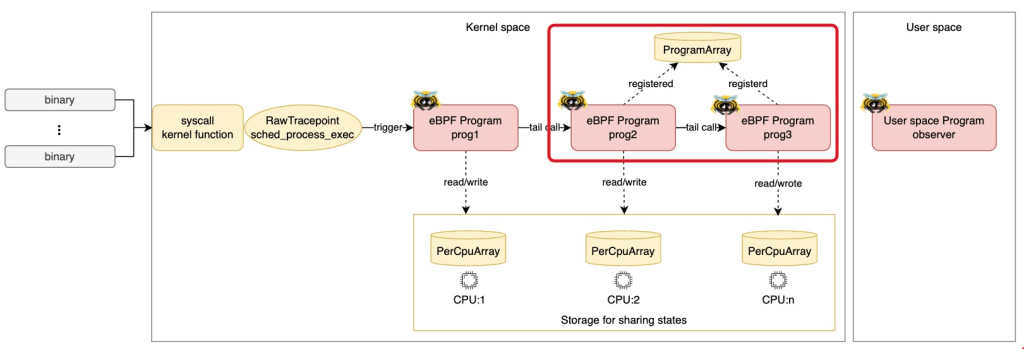
Let’s check the eBPF Map which is used for Tail Calls. The Map type is BPF_MAP_TYPE_PROG_ARRAY. In aya, it is defined as ProgramArray. You can find the map by the following command:
sudo bpftool map list name TAIL_CALL_MAP --json | jq .
Please confirm the type is prog_array.
Example output:
{
  "id": 340,
  "type": "prog_array",
  "name": "TAIL_CALL_MAP",
  "flags": 0,
  "bytes_key": 4,
  "bytes_value": 4,
  "max_entries": 2,
  "bytes_memlock": 344,
  "owner_prog_type": "tracing",
  "owner_jited": true,
  "frozen": 0,
  "pids": [
    {
      "pid": 97132,
      "comm": "observer"
    }
  ]
}
Next, let’s check values in the map by the following command:
sudo bpftool map dump name TAIL_CALL_MAP
There must be two entries. One represents prog2, another represents prog3.
Example output:
key: 00 00 00 00  value: c8 01 00 00
key: 01 00 00 00  value: c9 01 00 00
Found 2 elements
* The value c8 01 00 00 is the hexadecimal representation of 456 (0x000001c8) in little-endian format. The number 456 is the ID of prog2. Similarly, the value c9 01 00 00 represents 457. The number 457 is the ID of prog3.
Rust Code Highlights
Next, let’s see how the Codes configures the eBPF Programs and Maps.
ProgramArray Setup
In the kernel-space code, define the ProgramArray with max entries.
#[map(name = "TAIL_CALL_MAP")]
pub static TAIL_CALL_MAP: ProgramArray = ProgramArray::with_max_entries(2, 0);
In the user-space code, load prog2 and prog3 into kernel and set them in the ProgramArray.
let mut tail_call_map = ProgramArray::try_from(bpf.take_map(TAIL_CALL_MAP).unwrap())?;

// Set prog2 in the ProgramArray
let program: &mut BtfTracePoint = bpf.program_mut("prog2").unwrap().try_into()?;
program.load("sched_process_exec", btf)?;
let fd = program.fd().unwrap();
tail_call_map.set(0, fd, flags)?;

// Set prog3 in the ProgramArray
let program: &mut BtfTracePoint = bpf.program_mut("prog3").unwrap().try_into()?;
program.load("sched_process_exec", btf)?;
let fd = program.fd().unwrap();
tail_call_map.set(1, fd, flags)?;
Tail Calls
Specify the index in the tail_call function of ProgramArray in the kernel-space code. This allows us to easily perform a tail call to the eBPF programs as shown below.
#[btf_tracepoint(function = "prog1")]
pub fn prog1(ctx: BtfTracePointContext) -> u32 {
        ...
        let res = TAIL_CALL_MAP.tail_call(&ctx, 0);  // Call prog2
        ...
}


#[btf_tracepoint(function = "prog2")]
pub fn prog2(ctx: BtfTracePointContext) -> u32 {
        ...
        let res = TAIL_CALL_MAP.tail_call(&ctx, 1);  // Call prog3
        ...
}

#[btf_tracepoint(function = "prog3")]
pub fn prog3(ctx: BtfTracePointContext) -> u32 {
        ...
}
State Sharing with PerCpuArray

Sharing state in eBPF tail calls is challenging. This program uses eBPF Map: Per CPU Array with a single entry.
In the kernel-space code, define the PerCpuArray with a single entry.
#[repr(C)]
pub struct SharedState {
    pub per_event_count: u32,
    pub total_count: u32,
}

#[map(name = "PER_CPU_MAP")]
pub static mut PER_CPU_MAP: PerCpuArray<SharedState> = PerCpuArray::with_max_entries(1, 0);
Access the map as shown below, and perform initialization or updates as needed.
let shared_state = unsafe {
    let ptr = PER_CPU_MAP.get_ptr_mut(0).ok_or(0)?;
    &mut *ptr
};

// Initialize the value as needed.
shared_state.per_event_count = 1;

// The total_count is not initialized, just increment it.
shared_state.total_count += 1;
References
- Writing eBPF Tracepoint Program with Rust Aya: Tips and Example
- Writing eBPF RawTracepoint Program with Rust Aya
- Writing eBPF Kprobe Program with Rust Aya
- Aya Community’s discord
- How to write an eBPF/XDP load-balancer in Rust
Wrap up
This guide showcased how to implement eBPF Tail Calls in Rust using Aya, with a focus on user-space and kernel-space configurations. Tail calls enable efficient and scalable program logic management, making them a powerful tool in eBPF programming. I hope this guide helps you in your eBPF programming journey! 🦀🐝
